Dashboards
Research Overview
Publications by country, institution and author. Year-by-year growth and co-authorship network statistics.
- Top countries & institutions
- Temporal trends
- Author rankings
- Network metrics over time
Co-authorship Network
Interactive explorer: watch the collaboration network evolve year by year. Filter by minimum papers, search for an author.
- Year slider & animation
- Author search & highlight
- Min-papers threshold
- Community colour-coding
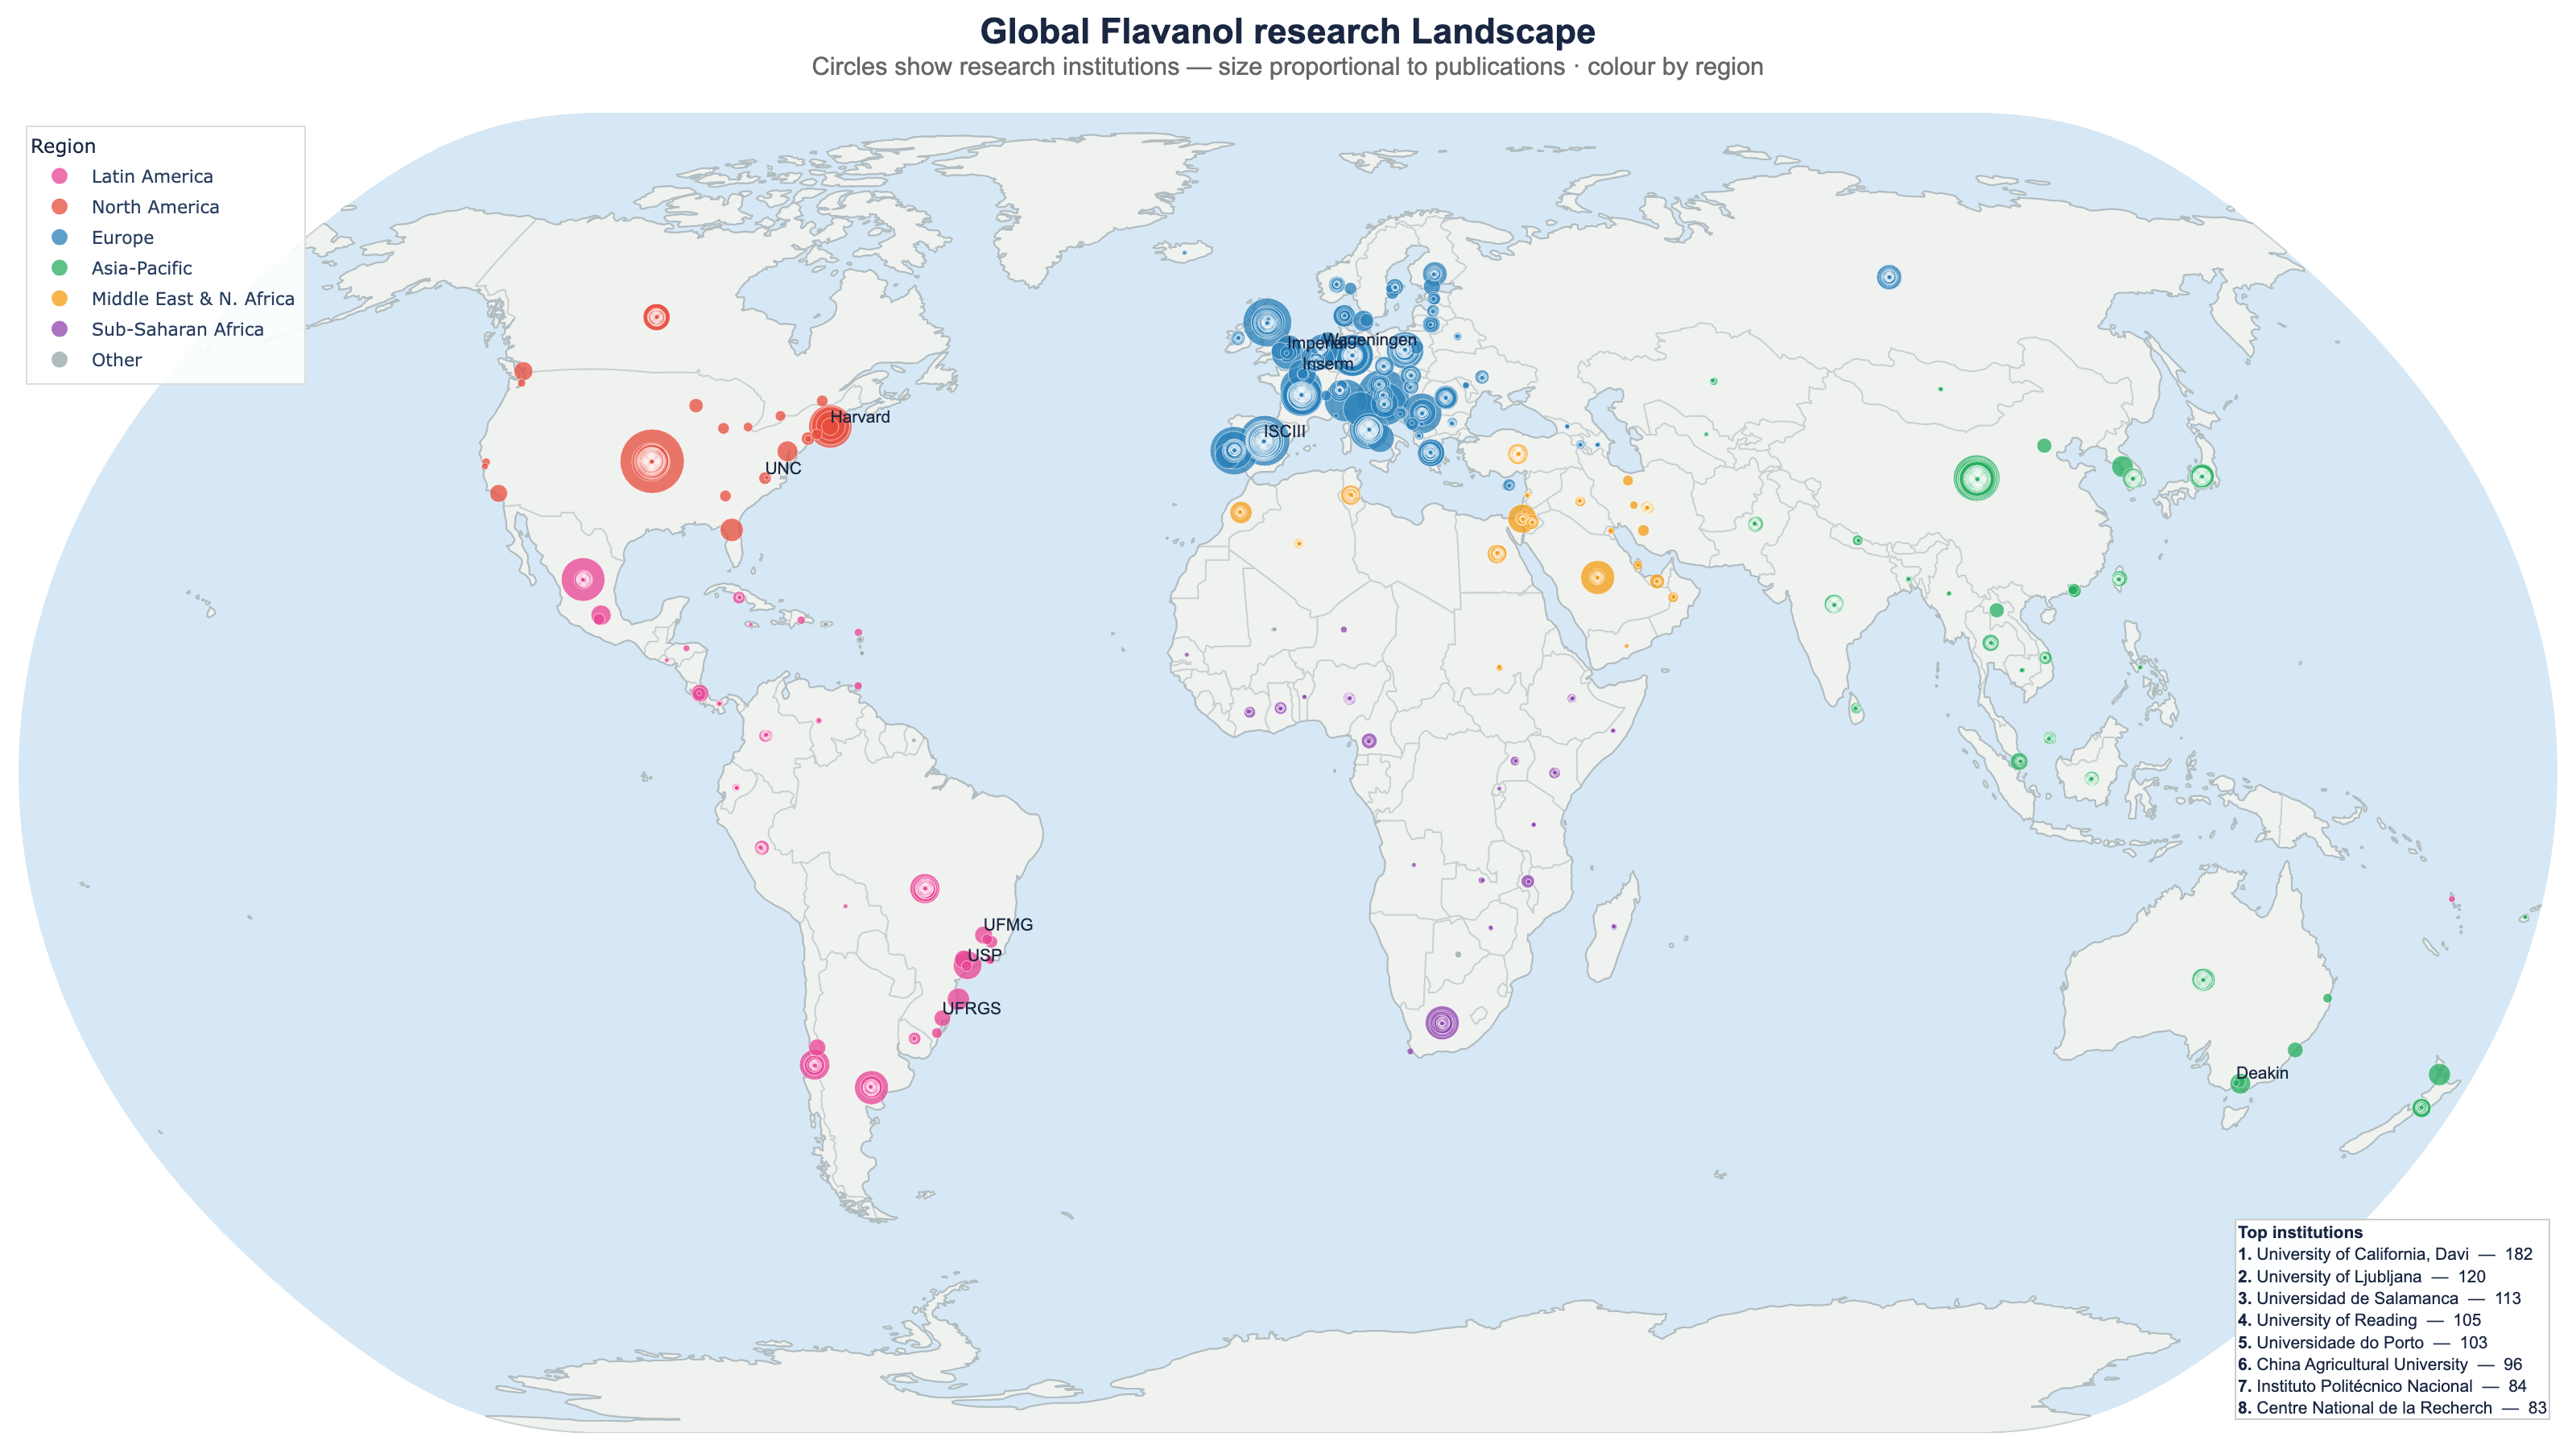
World Map
Global distribution of research institutions. Circle size proportional to publication output.
- Institution-level bubbles
- Colour-coded by region
- Hover for papers & citations
Study Types
Classification of papers by study design: RCTs, observational studies, systematic reviews, meta-analyses.
- Overall design breakdown
- Trends over time
- MeSH-tag classification
Study Type Network
Co-authorship network with nodes shaped and coloured by each author's dominant study type.
- Shape = study design (circle, diamond, triangle…)
- Year slider, animation & author search
- Clickable legend to isolate study types
Journal Analysis
Where is research published? Top journals by volume and citation impact, study-type breakdown per journal.
- Top journals by papers & citations per paper
- Study-type mix by journal (100% stacked bar)
- Publication trends
Paper Analysis
Individual paper details: top papers by citations, open access status, study type breakdown and year-by-year output.
- Top 50 papers by citations (hover for full title + DOI)
- Citation distribution histogram
- Papers per year: open access vs non-OA stacked bar
- Study type & open access donut charts
Citation Network
Who cites whom within this literature — internal citation graph and most-cited authors.
- Directed citation graph (top 300 nodes)
- Community-coloured nodes
- Most-cited authors bar chart
Citation Network Explorer
Fullscreen interactive explorer built on Cytoscape.js — draggable nodes, curved directed arrows, and per-edge paper details.
- Colour by country, research cluster, or publication volume
- Path finder: shortest citation path between two authors
- Click any edge to see the papers behind it
Static map
Click to open full-resolution PNG
Methods & Data
Data source
All publication data is retrieved from OpenAlex
— an open, freely accessible scholarly database. No API key is required.
Papers are identified by searching titles and abstracts for: flavanol, flavan-3-ol, flavan-3-ols.
Caveats
- Author-name disambiguation is handled by OpenAlex; occasional mis-attribution may occur.
- Institution assignment uses the most frequent affiliation across an author's papers.
- Funding data is incomplete — many papers have no recorded funder.
- Books and grey literature are poorly indexed.
- Study-type classification uses PubMed MeSH tags where available, falling back to title keywords; unclassified papers appear as Other.
- Author-position data (first / middle / last) is as assigned by OpenAlex.
Code
All code is open-source.
Entry point: python make_dashboard.py --fetch (retrieves data and rebuilds all charts).
See GitHub for full source.